Analysis of procurements and the supply chain
Scope
The information and data presented in the paragraph in an aggregated manner concern all companies included in the scope – please see Disclosing Sustainability: Methodological note – including the companies Gesesa, Gori and AdF, operating in the water sector, and Deco, in the environment sector, which are not managed centrally, and excluding Berg and Demap and two FTV companies, which together account for 1% of the costs of materials and services of the companies in the consolidation area.
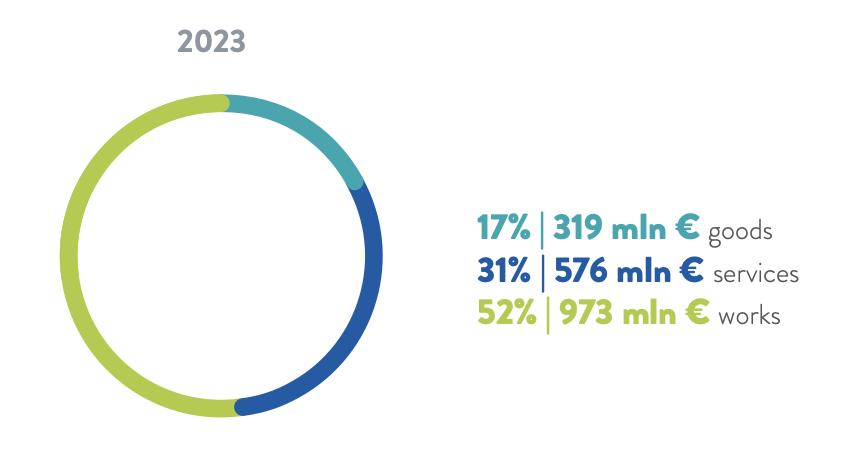
The value in 2023 of that ordered to procure goods, for the provision of services and the execution of works, as noted, was equal to around €1.9 billion127, stable with respect to 2022; when examining the distribution of value among the three components, compared to the figures from the previous year, the items “goods” and “works” increased (respectively by +35% and +15%) while “services” fell (-28%) (see table no. 42).
Chart no. 33 – Value of ordered goods, services and works and percentage on total (2023)

NOTE: Figures are rounded off to the nearest unit.
Examining the distribution of procurement amounts by business – Energy Infrastructure, Production, Commercial, Water, Environment, Engineering and Services - and for Corporate (Acea SpA), in terms of percentage changes with respect to the 2022 figures, the largest decreases can be seen in Commercial and Production, while significant increases were seen in Environment and Engineering and Services; the Water component continues to be the largest (see chart no. 34 and table no. 42).
Chart no. 34 – Orders (goods, services, works) by business area (2022-2023)

Note: Figures are rounded o to the nearest unit. The Energy Infrastructure business includes Areti, Production includes Acea Produzione, Ecogena and Acea Solar. Commercial includes Acea Energia and Acea Innovation. Water includes the companies: Acea Ato 2, Acea Ato 5, Gori, Gesesa, AdF. Engineering and Services includes Acea Infrastructure. Environment includes: Acea Ambiente, Aquaser, Acque Industriali and Deco. Present in the Corporate segment is only Acea SpA.
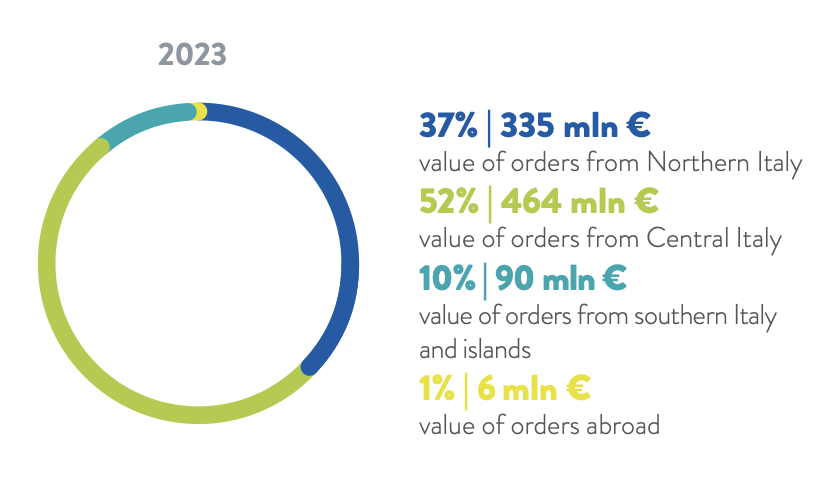
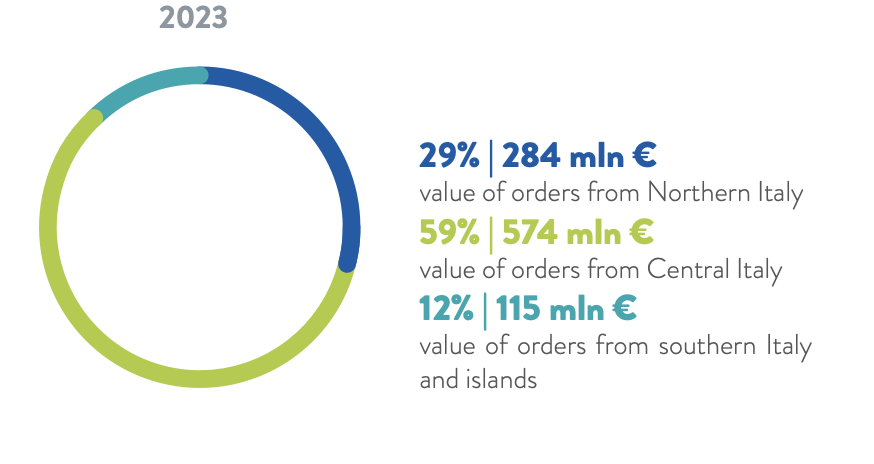
As mentioned, the procurement needs of the Group’s companies included in the scope in the year totalled 7,095 orders/contracts and involved 3,508 suppliers (slightly down with respect to the 3,780 in 2022). The geographic distribution of the suppliers in 2023 continued to see the largest portion coming from central Italy (48%), of which 23% in Lazio, followed by northern Italy (30%), southern Italy and the islands (20%) and only a residual 2% for- eign. The geographical distribution of the value of that procured, in terms of percentage weight on the total amounts (€ 895 million for goods and services and € 973 million for works), is more concentrated in central Italy, with 52% of the item “goods and services” and 59% of the item “works”, followed by northern Italy, which absorbs 37% of the item “goods and services” and 29% of the item “works” and by southern Italy and Islands (with 10% of the item “goods and services” and around 12% of the item “works”). During the year, around 33% of the value of “goods and services” and over 55% of the value of “works” were concentrated in Lazio (charts 35 and 36, and Table 43).
Chart no. 35 – Geographical distribution of the amounts for goods and services in Italy and abroad (2023)

NOTE: figures are rounded off to the nearest unit.
Chart no. 36 – Geographical distribution of the amounts of works awarded in Italy (2023)

Note: Figures are rounded o to the nearest unit. In 2023, for the companies in the scope, the value of foreign procurement was minimal, with a percentage impact of zero.
Table no. 42 – Procurement data (2022-2023)
| u. m. | 2022 | 2023 |
Δ% 2023/2022 |
|
| VALUE OF PROCUREMENT THROUGH TENDERS | ||||
|
goods |
million € |
236 |
319 |
35% |
|
services |
million € | 800 |
576 |
-28% |
|
works |
million € | 844 |
973 |
15% |
|
total |
million € |
1,880 |
1,869 |
-1% |
|
GOODS, SERVICES AND WORKS AS A PERCENTAGE OF TOTAL ORDERS |
||||
|
goods |
% | 13% |
17% |
31% |
|
services |
% | 42% | 31% | -26% |
|
works |
% | 45% | 52% | 16% |
|
VALUE OF ORDERS BY BUSINESS AREA |
||||
|
Networks (Energy Infrastructure) |
million € | 325 | 234 | -28% |
|
Generation |
million € | 81 | 32 | -60% |
|
Commercial |
million € | 238 | 55 | -77% |
|
Water |
million € | 851 | 990 | 16% |
|
Engineering and services |
million € | 22 | 37 | 70% |
|
Environment |
million € | 189 | 380 | 101% |
|
Corporate |
million € | 174 | 141 | -19% |
|
NUMBER OF PURCHASE ORDERS MANAGED |
||||
|
POs for goods, services and works |
no. |
7,837 | 7,095 | -9% |
Note: all the figures in the table are rounded off to the nearest unit.
Table no. 43 – Procurement nationwide (2022-2023)
| u. m. | 2022 | weight as % of total/year | 2023 | weight as % of total/year | |
| NUMBER OF SUPPLIERS OF GOODS, SERVICES AND WORKS NATIONWIDE | |||||
|
suppliers north Italy |
no. |
1,136 | 30% | 1,037 | 30% |
|
suppliers central Italy |
no. | 1,956 | 52% | 1,698 | 48% |
|
suppliers Lazio |
no. | 969 | 26% | 811 | 23% |
|
suppliers south Italy and islands |
no. | 617 | 16% | 713 | 20% |
|
foreign suppliers |
no. | 71 | 2% | 60 | 2% |
|
total suppliers |
no. | 3,780 | 100% | 3,508 | 100% |
|
GEOGRAPHICAL BREAKDOWN OF AMOUNTS FOR GOODS AND SERVICES |
|||||
|
value of orders from Northern Italy |
million € | 327 | 32% | 335 | 37% |
|
value of orders from Central Italy |
million € | 566 | 55% | 464 | 52% |
|
value of orders from Lazio |
million € | 419 | 40% | 297 | 33% |
|
value of orders from southern Italy and islands |
million € | 103 | 10% | 90 | 10% |
|
value of orders abroad |
million € | 40 | 4% | 6 | 1% |
|
total value of orders for goods and services |
million € | 1,036 | 100% | 895 | 100% |
|
GEOGRAPHICAL BREAKDOWN OF AMOUNTS FOR WORKS |
|||||
|
value of orders from Northern Italy |
million € | 103 | 12% | 284 | 29% |
|
value of orders from Central Italy |
million € | 613 | 73% | 574 | 59% |
|
value of orders from Lazio |
million € | 505 | 60% | 541 | 56% |
|
value of orders from southern Italy and islands |
million € | 128 | 15% | 115 | 12% |
|
value of orders abroad |
million € | 0 | 0% | 0 | 0% |
|
total ordered for works |
million € | 844 | 100% | 973 | 100% |
Note: all the figures in the table are rounded o to the nearest unit. The “northern Italy” geographical area includes Valle d’Aosta, Piedmont, Lombardy, Veneto, Trentino-Alto Adige, Friuli-Venezia Giulia, Emilia-Romagna and Liguria; “central Italy” includes Tuscany, Umbria, Marche, Lazio, Abruzzo and Molise; “southern Italy and islands” includes Campania, Basilicata, Apulia, Calabria, Sicily and Sardinia. The geographical area “abroad” includes suppliers that are mainly European.
127 The amount of purchases managed at the centralised level refers to tenders awarded during the year, without any distinction between investments and operating cost, annual and multi-annual contracts. Purchases of commodities, regularisation orders and intercompany orders are excluded. The figures for the companies that are not centrally managed, for a total of " 346 million, do include all purchase types.